Data Collection in Action: An Experiment by Upper Primary Students


Anecdotal Account of Response to the Question: I am a boy and I have a sibling. Is my sibling a girl or a boy?
At first, when we heard of this problem in our class, many of us felt that there were equal chances of the sibling being a girl or a boy.
To confirm our answers, we were asked to collect data and see if the data shows the same results. Thus, we used Statistics and Mathematics. Below is an account of the individual processes that each of us followed when we were given this task.
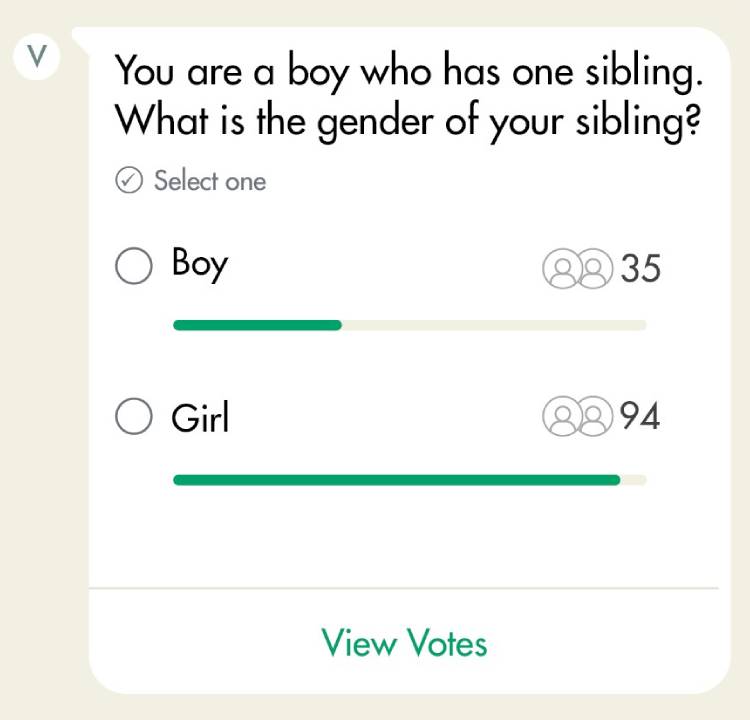
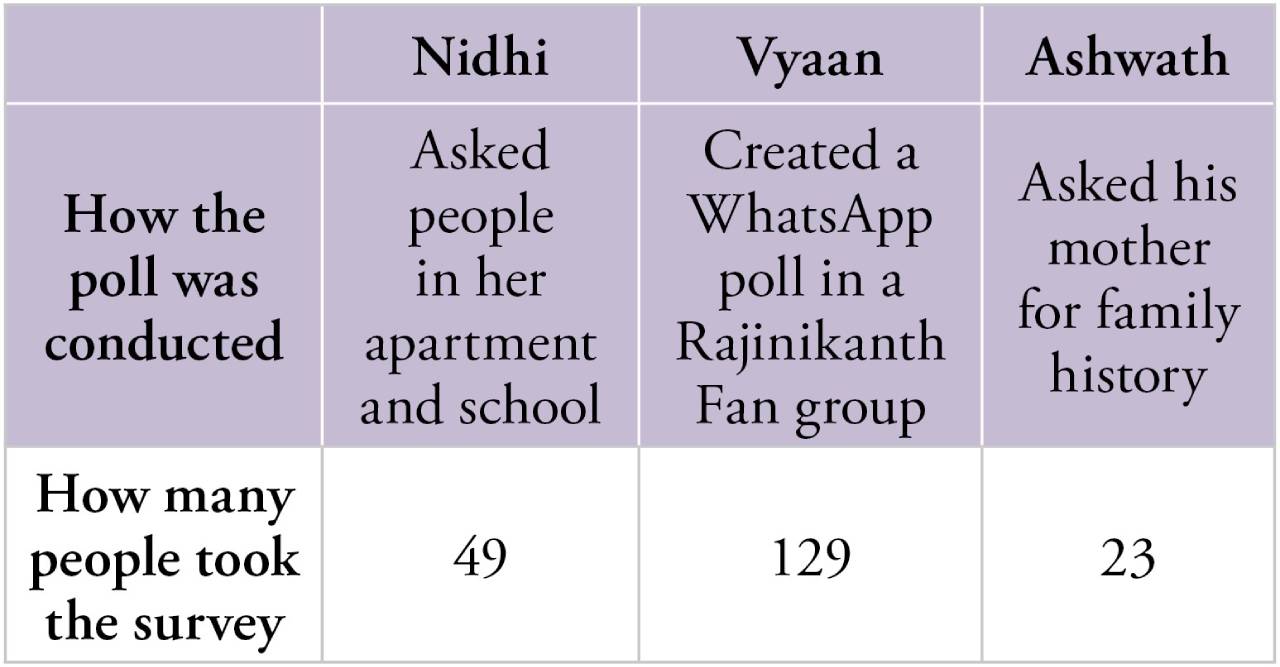
Vyaan: I did this experiment by collecting data on a WhatsApp poll in a group which had 129 males with exactly one sibling, and I got this result.
Out of the total of 129 outcomes, there were 94 boys who had sisters. Using the basics of probability that I knew, I calculated the chance of the sibling of a boy being a girl was 94/129 ≈ 2/3
Ashwath: I asked my mother to tell me the family details of our male relatives who had exactly one sibling and I tabulated them into two columns – Boy-Girl pair and Boy-Boy pair. From the data that I had collected, there were:
- 16 Boy-Girl / Girl-Boy pairs
- 7 Boy-Boy pairs

The ratio of Boy-Girl / Girl-Boy pairs to total number of pairs was 16/23 ≈ ⅔.
Nidhi: When I thought of the question before looking at the data I collected, I assumed that there was a 50% chance of the sibling being a boy (or a girl). To check if my intuition was correct, I went about asking male members in my housing society and boys in my school if they had exactly one sibling, and if so, what their gender was. The statistics were counter-intuitive! Below is the summary of the data I collected from different people.
Since one of the siblings had to be a boy, there were two different groups that people could be segregated in:
- Boy with Boy sibling
- Boy with Girl sibling / Girl with Boy sibling
Data that I got was:
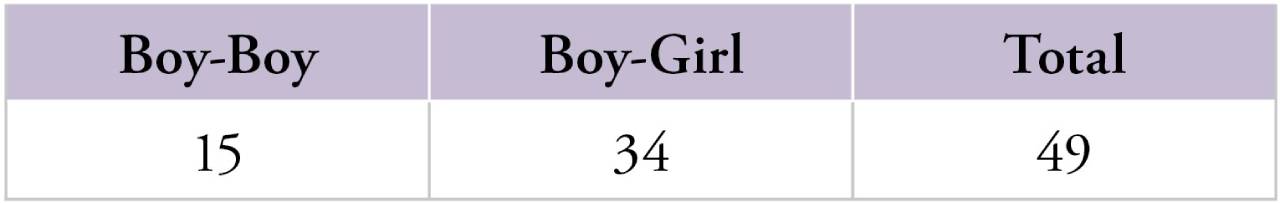
Boy-Girl pairs / total number of pairs = 34/49 ≈ 2/3
Vinay: As I had hoped, both Data Collection and Data Handling became interesting using this example that was relevant for many students. It was not difficult for them to collect the data and they were able to get a hands-on experience about different ways to collect data and then analyse it.
Once the students came back with their findings, I continued the discussion as given below.
Let’s say that we have 100 pairs of siblings. There will be four types of sibling pairs. In statistics, we say that there is a 25% chance of each type of pair.
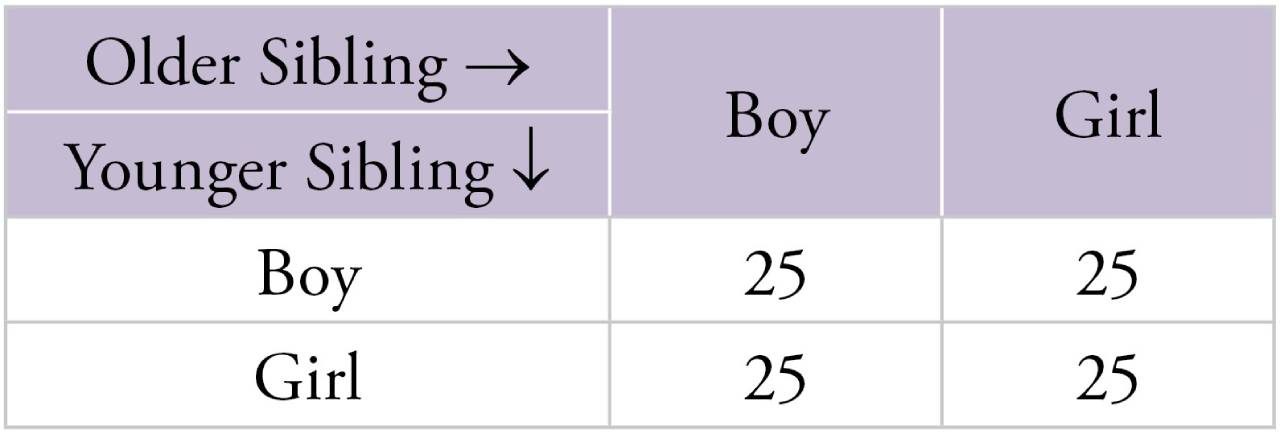
If we have a boy-girl pair we have 50 pairs (25 where the girl is older than the boy + 25 where the boy is older than the girl).
There are only 25 boy-boy pairs. Here we do not consider a girl- girl pair, as we know for certain that one of the siblings is a boy. Therefore, the probability of getting a boy-girl pair would be greater than the probability of getting a boy-boy pair.
P (getting boy-girl pair) = 50/75 = 2/3
After we reasoned out our findings from the data collection exercise, we found that the chance of the sibling of a boy being a boy or a girl is not equal! And in answer to our friend’s question, we should have said that his sibling was most likely a girl!
We also noticed how everyone had a different approach to conduct the survey.
Although there were a lot of methods, the probability we arrived at was roughly the same. All in all, this problem truly intrigued us all, as something that we all expected to be right, turned out to be wrong!
Comments from the teacher
When the question ‘whether the sibling was a boy or a girl’ was posed to the students initially, the students felt intuitively that the answer is obvious and that there is a 50:50 chance of the sibling being a boy or a girl. This sparked a discussion on how to find out if this was true or not. Since the students weren’t exposed to conditional probability, they only had loose arguments and intuition to back their answers. The discussion then led to the question of a tossing-two-fair-coins problem and the students had to debate whether Heads in the first coin and Tails in the second, was the same as Tails in the first coin and Heads in the second. The students seemed to be convinced that for a coin toss, HT and TH are two of the possible outcomes but they were not sure if the same would apply to the Boy-Girl and Girl-Boy order.
Towards the end of this discussion, some of them were convinced that the chance for the other child being a girl would be 2/3, but some of the students in the class weren’t convinced. They also wanted to know if this would happen in reality. This is what led to the discussion of designing an experiment through which one can determine whether the answer that we get using mathematics will match with reality.
The students were then asked to collect the data and analyze. No guidance or hints were given to the students on how to go about the process of data collection. It was completely their choice. After the data collection, the students also voted for each other’s methods and commented which method was better than the other. For instance, someone said that in the data collected through the WhatsApp group, we don’t know every member personally and hence the data may not be reliable. Someone said that when data is collected from a particular family, there could be some biological factors which may lead to more members of a particular gender. Thus, it can also be skewed.
These discussions also brought out the intricacies of data collection and how careful one should be while collecting the data if they have to rely on the same. While there is a lot of emphasis on data representation and data handling, introducing data collection can also be part of an activity. When it is followed by discussions, students will be forced to think critically and evaluate. It will also bring out their creative skills in data collection and analysis. While meaningful collection of valid data is one aspect of this article, the other is understanding the logic of the reasoning using elementary understanding of probability.