The Tricky Truth about Visualising Fractions


All is not as it seems!
I have often seen my students, even in high school, make mistakes in fraction addition such as the one shown in Figure 1. I routinely attributed this to an error in understanding the underlying algorithm, what I refer to as a “method error”. I did not see this as an issue with conceptual understanding, until I was unexpectedly pulled into a primary classroom one day.
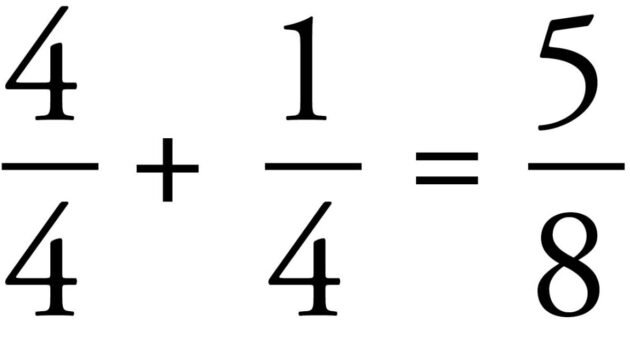
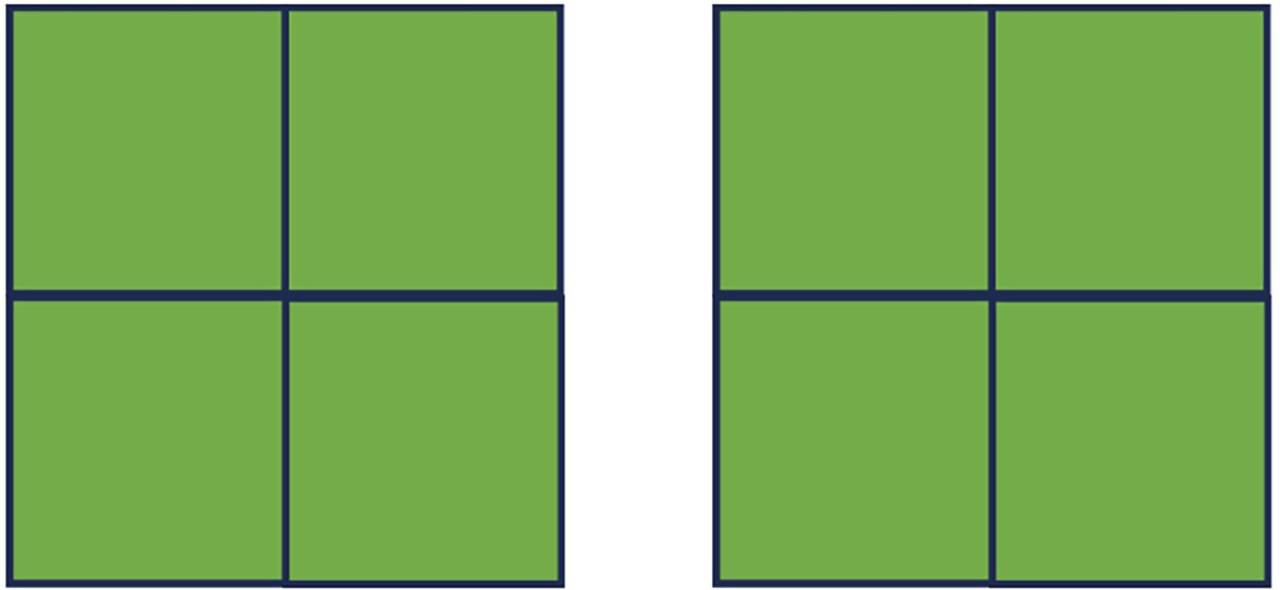
A substitute teacher caught me passing by her class and called me in to help her. She had the diagram in Figure 2 drawn on the board. Before we get to the reason the teacher invited me into her class, take a moment to think about the question in the figure. What do you think the answer to the question is? Can you explain the reasoning behind your answer?

The students in the classroom had come up with two answers for the question. The teacher requested, “Can you explain to the children why the shaded region represents \(\tfrac{5}{4}\) and not \(\tfrac{5}{8}\) ?”
How would you respond to this request?
The burden of an unsatisfying solution
I have to admit that I was thrown off-guard. While I understood how method-based errors could creep up in student work, I was at a loss to understand how even visual diagrams could lead to misunderstanding. I would like to believe that I recovered quickly enough and convinced at least a few students why the shaded region represented \(\tfrac{5}{4}\) . You might be familiar with the argument that I presented. As illustrated in Figure 3, I started with one “cake” cut into four equal parts and tried to build up the idea of non-unit fractions as multiple slices/pieces of a unit fraction (one-fourth in this case). Two pieces of one-fourth would be numerically represented as \(\tfrac{2}{4}\) and be read as two- fourths, and so on up to five-fourths, which is 1 whole cake and a one-fourth.
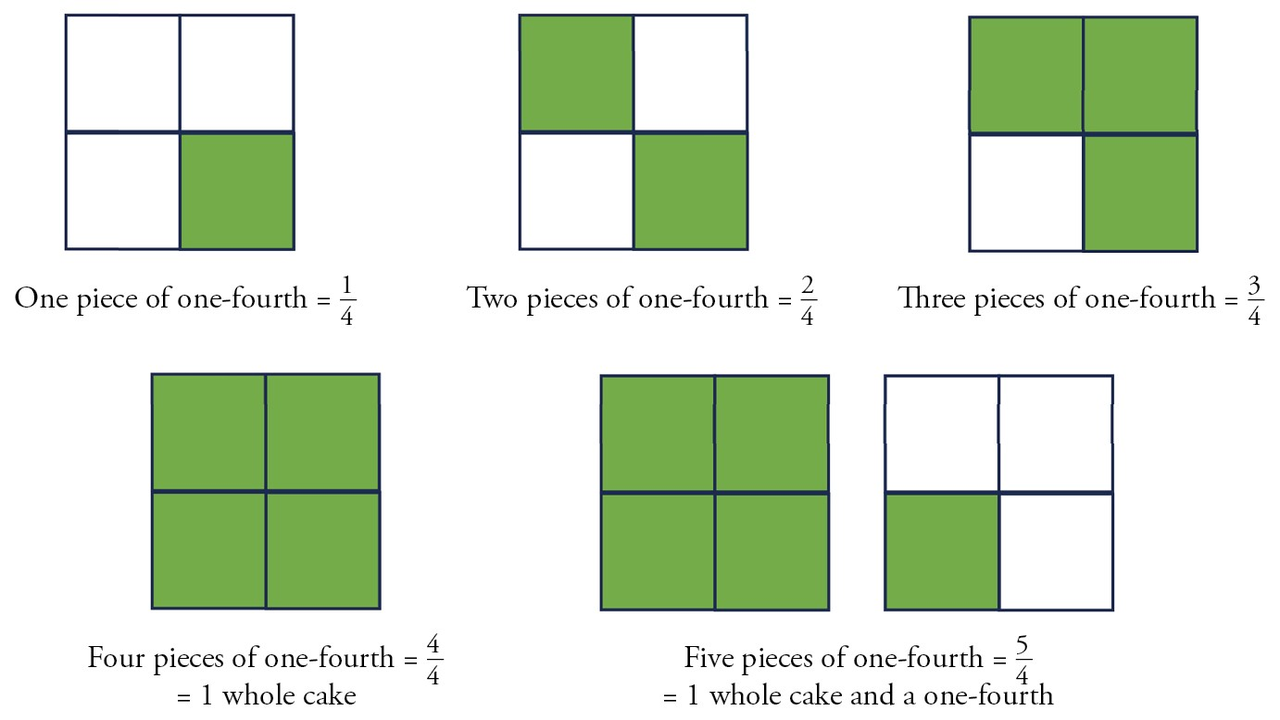
The confusion from Figure 2 is a common one that we witness when fractions are taught as “number of shaded parts ÷ total number of parts”. So, instead, I tried to draw the students’ attention to the size of each piece and what a “quarter” or “one-fourth” meant.
Apart from some uncertainty over whether I had pitched my reasoning at the right level for primary school, I also left with a nagging feeling that the confusion was perfectly valid. Visualising fractions was not as intuitive as I thought it was!
The light at the end of the tunnel
It was not until a year or two later that I ran into an explanation that made most sense to me. The lecturer at a teacher professional development course that I was attending, posed the question from Figure 2 and asked if the shaded region was \(\tfrac{5}{4}\) , \(\tfrac{5}{8}\) , or \(\tfrac{5}{2}\). Imagine my confusion at seeing \(\tfrac{5}{2}\) as an option!
Let me spare you the misery, and cut to the chase. The key to making sense of this question is to ask
“what is one whole?“
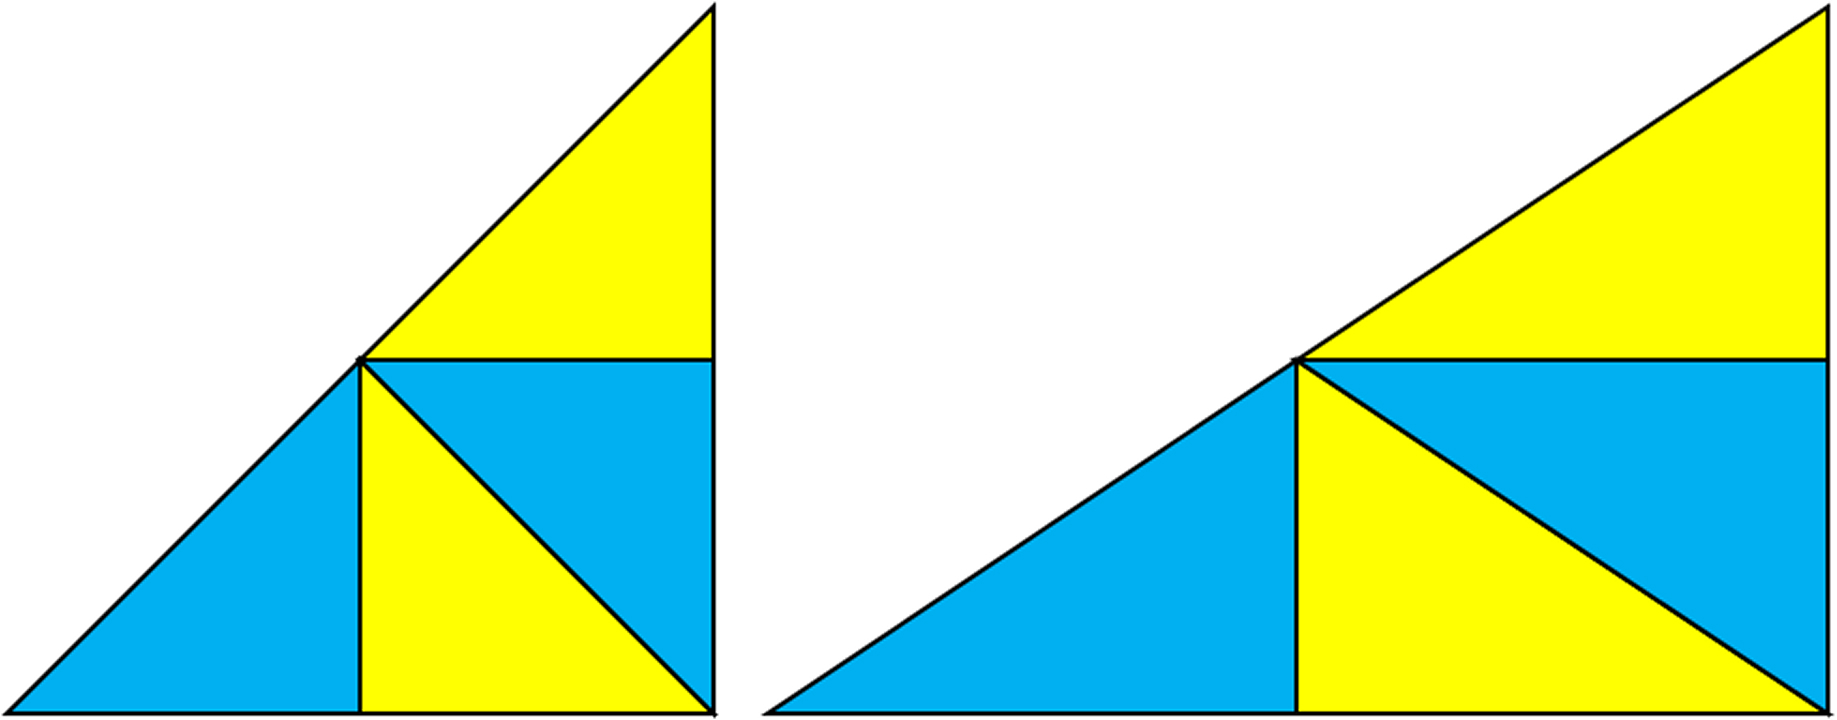
If one whole is
then, the fraction that captures the shaded region in Figure 2 is \(\tfrac{5}{8}\).
Can you now see how \(\tfrac{5}{2}\) could possibly be an answer?
If one whole is’

then, the fraction that captures the shaded region in Figure 2 is \(2\tfrac{1}{2}\) or \(\tfrac{5}{2}\).
When I jumped into my explanation in the primary classroom, I did so with my own assumption of one whole – absolutely clear in my mind that there could be no other logical reasoning. It is important that I explicitly state the value of asking “what is one whole” and understanding the multiple solutions for this seemingly harmless problem. This kind of understanding and reasoning can help a teacher differentiate between an error and a misconception, and provide appropriate clarification and support to the student. I do not mean to suggest that a teacher should provide such a detailed explanation every time the classroom stumbles upon improper fractions. Just repeatedly drawing attention to “what is one whole?” may suffice in most cases.
Into the light
Through the numerical example in Figure 1 and its visual equivalent in Figure 2, I have tried to draw attention to a common confusion in fraction addition. Based on a personal anecdote, I make the case that one possible explanation for this confusion could be our understanding of what “one whole” is. I argue that explicitly stating or asking what “one whole” looks like can help with better conceptual understanding and challenge long-held assumptions.
The accompanying worksheet showcases this idea and provides multiple examples for you to try and reflect on.