

Comparing Fractions using Estimation

In a workshop for primary school teachers organized in the southern part of Rajasthan, I had an opportunity to discuss different strategies adopted to estimate the value of fractions and I used this opportunity to stress the importance of connecting the value with context.
I observed four different approaches followed by the participating teachers.
| Method Used | Pre-requisites | Advantages | Disadvantages |
|---|---|---|---|
| Converting fractions into decimal form as 0.75, 0.87, 0.80, 0.66, 0.94, 1.16, 0.5 and 0.66, and arranging the fractions in ascending order according to the decimal values obtained. | Understanding of:
|
|
The method utilised can reduce to a mechanical application of an algorithm which doesn’t enhance understanding of the quantity represented by the fraction. |
| Converting all fractions into like fractions by finding LCM of denominators as 360 and then finding the respective equivalent fractions as, \(\frac{270}{360}\), \(\frac{315}{360}\), \(\frac{288}{360}\), \(\frac{240}{360}\), \(\frac{340}{360}\), \(\frac{420}{360}\), \(\frac{180}{360}\), \(\frac{240}{360}\). |
Understanding of:
|
Can be applied to compare any two or more fractions. | As above, there is a danger of blind application of the algorithm. |
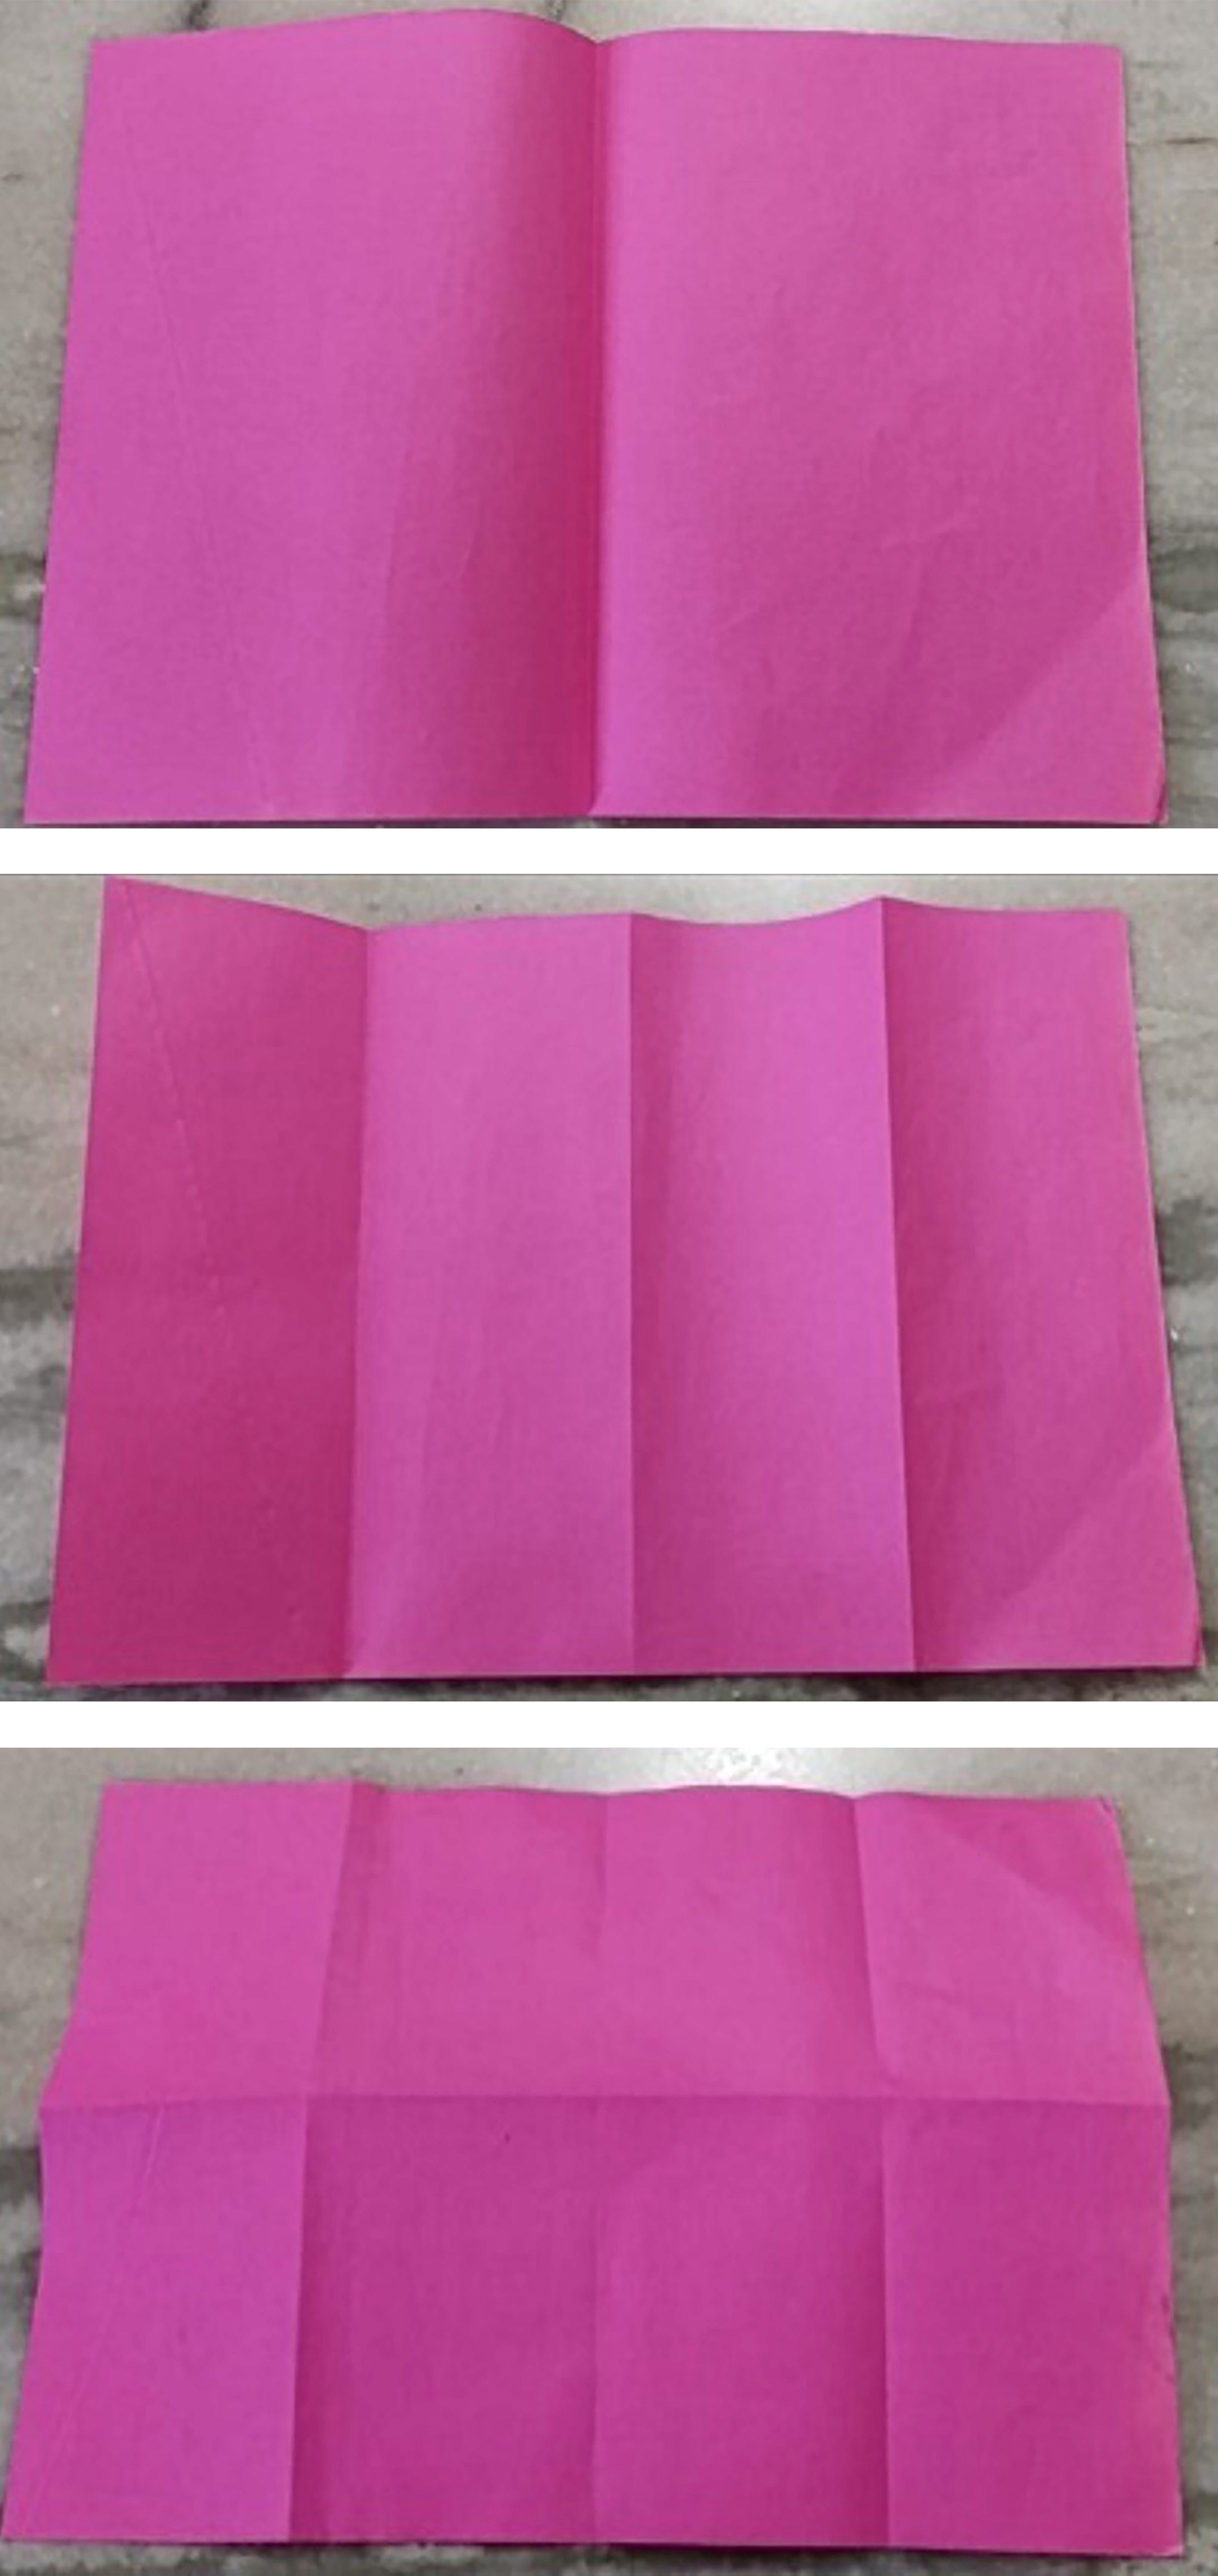 |
Understanding of part-whole and representation of fractions through area model. |
|
Struggled to represent and compare for all fractions- Couldn’t divide the paper into five equal parts to represent \(\frac{4}{5}\). |
Used the following rule:
|
Used the rule as a trick but showed no understanding of the reasoning behind it. (The logic behind the rule will be explained.) |
||
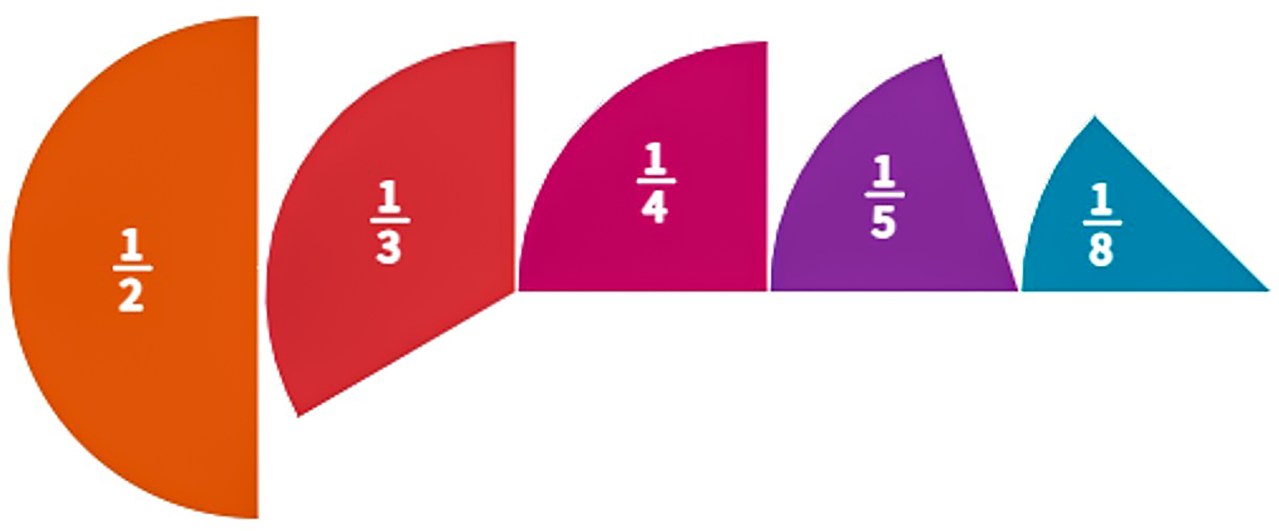
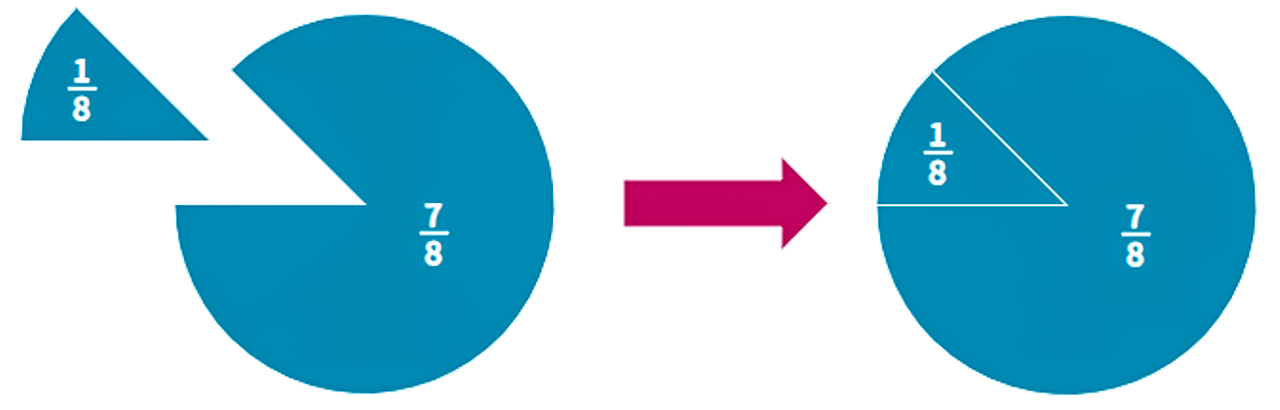
What could be the logic for the last response? The following are the unit fractions corresponding to $\frac{1}{2}, \frac{2}{3}, \frac{3}{4}, \frac{4}{5}, \frac{7}{8}$ in relation to a circle as whole (Figure 1). These parts when added to the fractions $\frac{1}{2}, \frac{2}{3}, \frac{3}{4}, \frac{4}{5}, \frac{7}{8}$ respectively, will make a whole. It is obvious from Figure 1 that $\frac{1}{8}$ is the smallest among the given parts. When added to $\frac{7}{8}$ it will make 1 (see Figure 2). And thus $\frac{7}{8}$ must be the greatest among these five fractions, in which the difference between numerator and denominator is equal to one. (In my opinion, such visuals help students to model the reasoning behind such rules.)
What can be done to build this understanding of fractions so that they associate the fraction with the related quantity? The NCERT textbook of Class 3 ‘Maths Mela’ follows the approach of introducing children to fractions using the context of equal sharing. To my understanding, this may be for two reasons. First, they have dealt with the situation of equal sharing while learning division and second, it helps them to realize the need for fractional numbers (with a numeric value). Children visualizing $\frac{1}{4}$ as part of the chapati that each child will get when one chapati is divided equally among four children, will always reason that $\frac{1}{4}$ is less than $\frac{1}{2}$. At the early stage, this understanding should be supported with paper cutouts to help them see and understand what part of the whole a fraction is. How does it further help in estimating a fraction? Let us see the steps which the particpating teachers went through in the workshop.
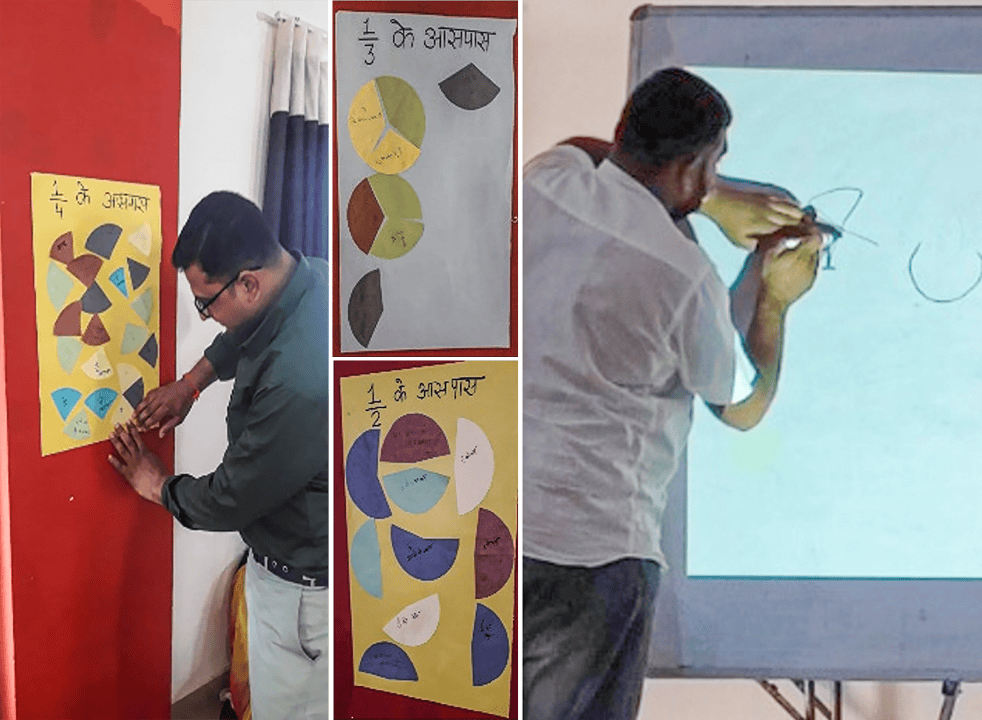
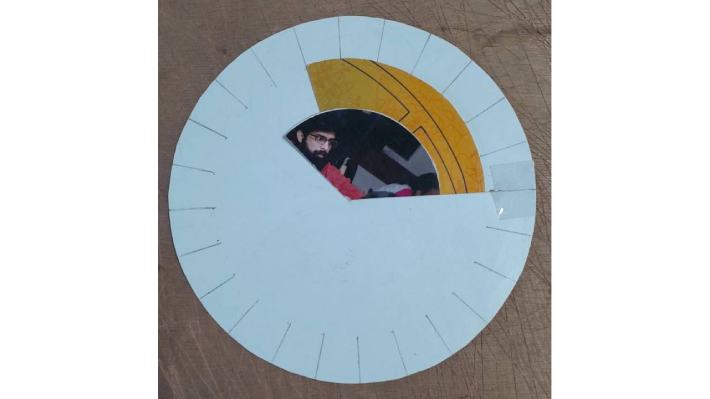
Step 1: Some cut-outs of paper (representing fractions close to half or quarter of a circle) were distributed among participants and they were instructed to estimate whether each cut-out was closest to the fractions $\frac{1}{2}$ or $\frac{1}{3}$ or $\frac{1}{4}$ or $\frac{1}{6}$. Then they were asked to paste these cutouts on the chart papers marked ‘Approximately $\frac{1}{2}$ (or $\frac{1}{3}$ or $\frac{1}{4}$ or $\frac{1}{6}$). Also, they were instructed to write on the cut-outs whether the cut-out is representing more or less than the closest fraction identified. To estimate for cut-outs representing approximately $\frac{1}{6}$, I noticed that they attempted to make the whole by repeatedly making outlines of these cutouts and seeing approximately how many such parts are needed to make the whole. When I tried a similar activity with students, their approaches were quite similar to that of the teachers. This experience of estimating approximate fractions for cut-outs (visualised as part of a chapati) helps students with comparison through estimation.
Step 2: The participants in the workshop now tried to sort $\frac{6}{20}$, $\frac{14}{29}$, $\frac{3}{10}$, $\frac{15}{31}$, $\frac{7}{26}$, $\frac{16}{17}$, $\frac{97}{100}$, $\frac{4}{10}$, $\frac{8}{18}$, $\frac{5}{17}$, $\frac{9}{31}$ into three categories based on their degree of closeness to fractions such as $\frac{1}{2}$, $\frac{1}{4}$, and 1. The equal sharing model helped teachers visualise the part of the chapati represented by each fraction. In Figure 4, I have illustrated the strategy used for three of the fractions $\frac{8}{18}$, $\frac{16}{17}$, and $\frac{7}{26}$.
For $\frac{8}{18}$, we considered 8 chapatis, each divided into halves. 16 children would get $\frac{1}{2}$ a chapati each. So, if 8 chapatis are equally distributed among 18 children, each would get less than half ($\frac{1}{2}$).
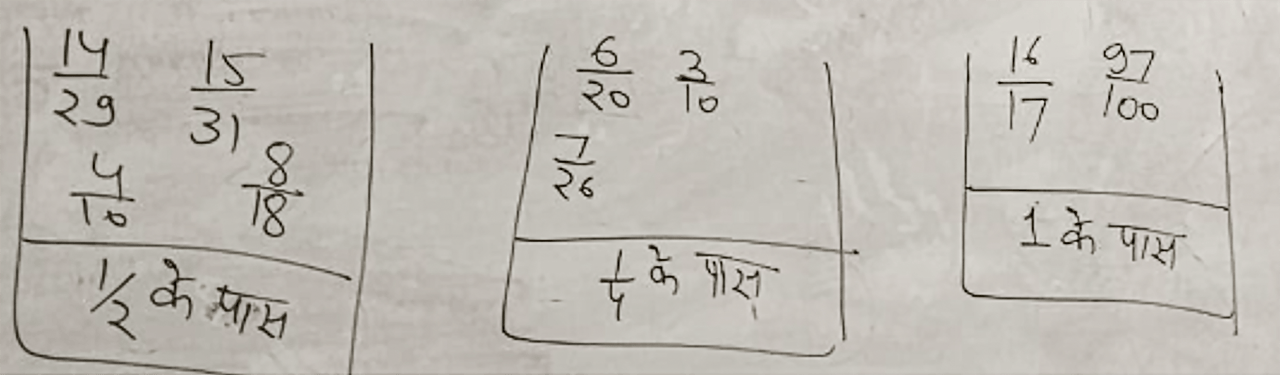
The context of equal sharing in this case helped visualise quantities relative to a whole (chapati in this case). It first indicated if the given fraction is closer to 1, $\mathit{\frac{1}{2}}$ or $\mathit{\frac{1}{4}}$ and then if it is less than or more than these reference values.
Now consider $\frac{16}{17}$. When 16 chapatis are divided equally among 16 children, each would get one chapati. When there are 17 children, each would get slightly less than one chapati. What about $\frac{7}{26}$? 7 chapatis divided into halves would give 14 children half a chapati each. When the 7 chapatis are divided into quarters, 28 children would get a quarter of a chapati each. When there are only 26 children, each child would get slightly more than $\frac{1}{4}$ of a chapati.
Step 3: What if both the fractions are close to 1 but less than one? Let us extend this further, by considering two fractions $\frac{7}{8}$ and $\frac{5}{6}$. (This would be more relevant for upper primary grades.) If we attempt an exercise to put these fractions in the three categories mentioned above, both will lie in the third category being close to 1. Then how can they be compared? As seen earlier, $\frac{1}{8}$ must be added to $\frac{7}{8}$ and $\frac{1}{6}$ must be added to $\frac{5}{6}$ to make a whole. $\frac{1}{8}$ being the smaller fraction needed to make it a whole, $\frac{7}{8}$ must be the larger fraction.
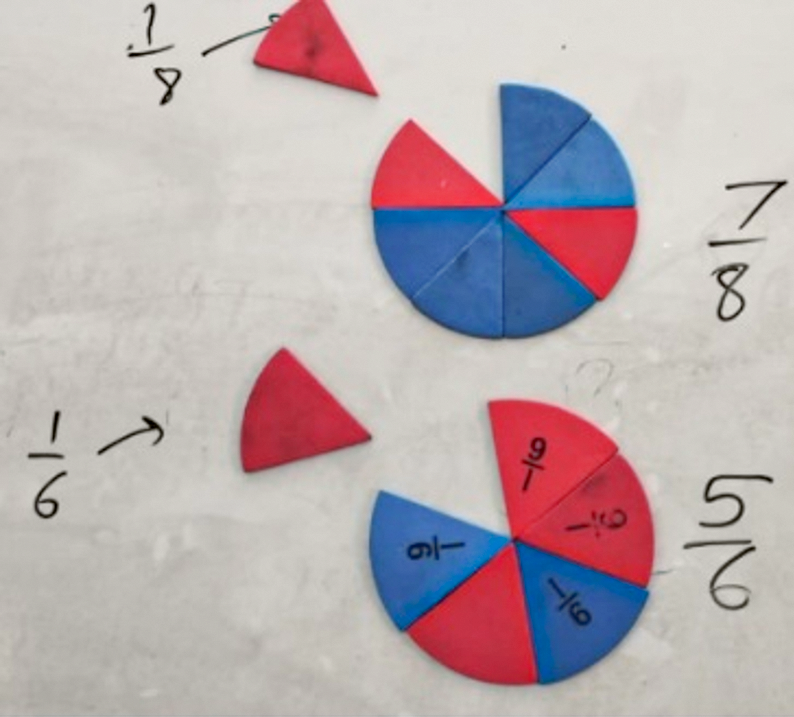
Comparing by how much the fraction is less or more than the reference value $\mathit{(1, \frac{1}{2}, \frac{1}{4})}$ will help estimate a wider range of fractions. Representation through visuals help students evolve such strategies of estimation.
Illustration of using these strategies with an example
I am sharing with you an attempt to arrange the given fractions $\frac{5}{16}, \frac{4}{7}, \frac{8}{9}, \frac{3}{40}$ in ascending order by two participants, Dilip and Ritu.
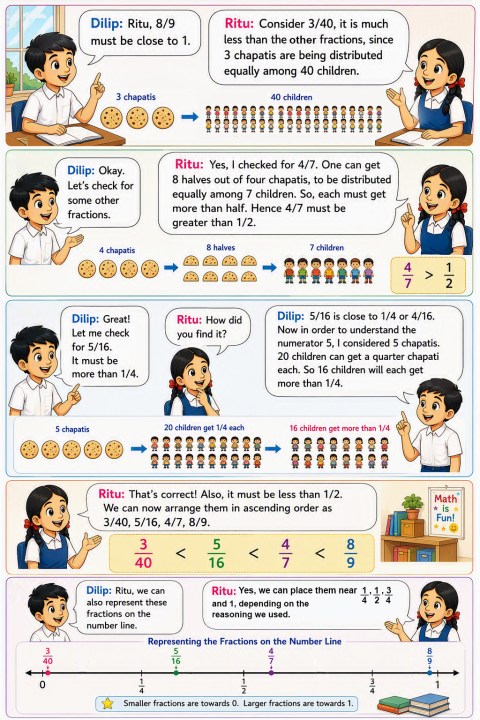
Context provided them with thinking models to visualize fractions and compare through estimation. Research suggests that students need experiences that build on their informal fraction knowledge before they are introduced to fraction symbols. Here we used the context of equal sharing of chapatis to develop that sense. Children might evolve some strategies on their own in primary classes when exposed to the use of visuals or materials and related to their context, and it is important that they communicate these in their own informal language when they do. And as the participants of the workshop said, it is important that the teachers walk this journey of understanding before their students do.

In a nutshell: